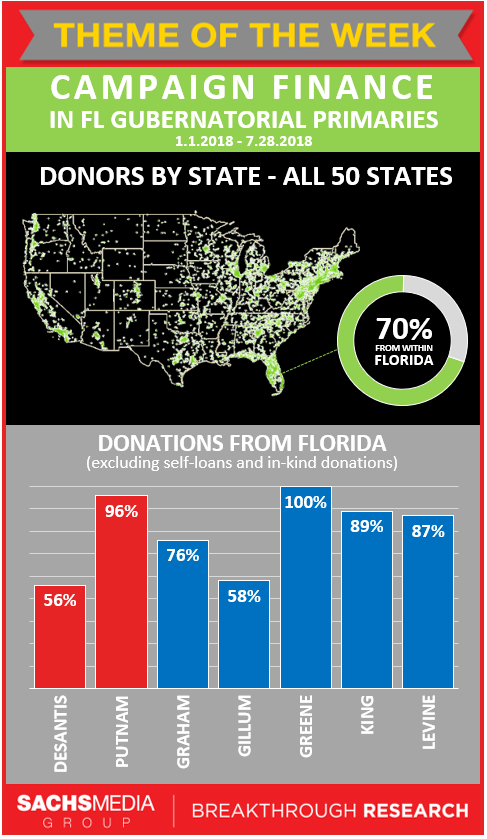
Research infographic depicting donors by state for the Florida gubernatorial primaries. The bar graph describes donations from Florida, excluding self-loans and in-kind donations, categorized by candidate.
Florida News Straight From the Source
Posted on

Research infographic depicting donors by state for the Florida gubernatorial primaries. The bar graph describes donations from Florida, excluding self-loans and in-kind donations, categorized by candidate.
Posted on
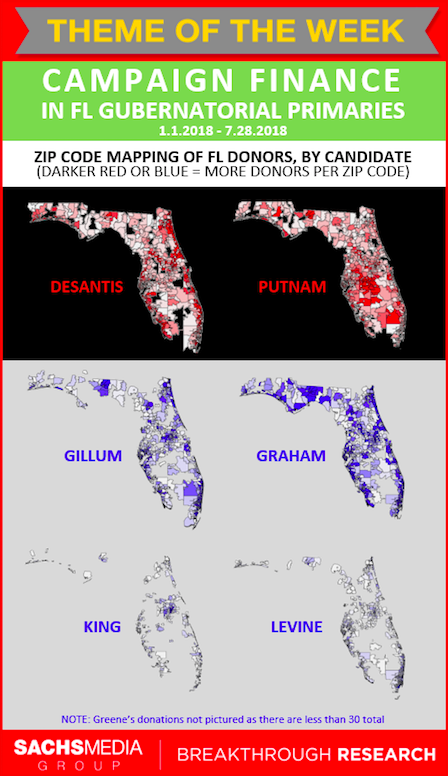
Research infographic depicting zip code mapping of Florida donors for the Florida gubernatorial primaries categorized by political affiliation and candidate.
Posted on
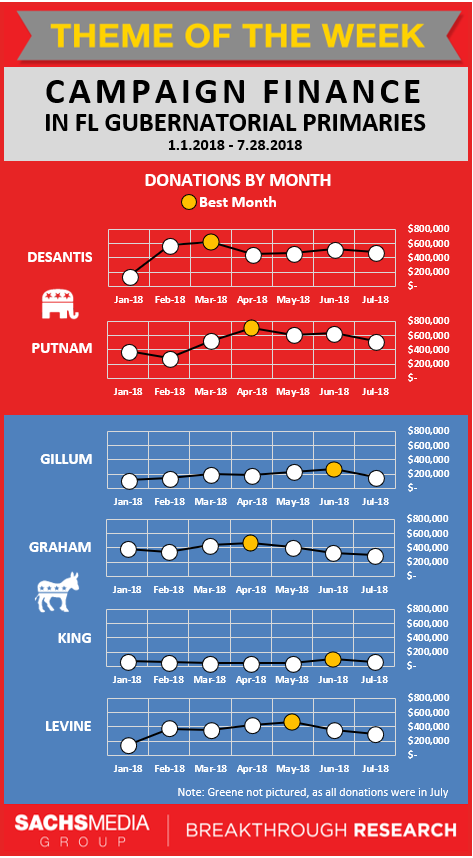
Research infographic describing the number of monthly donations for the Florida gubernatorial primaries categorized by political affiliation. Each line graph depicts the month with the highest number of donations for each candidate.
Posted on
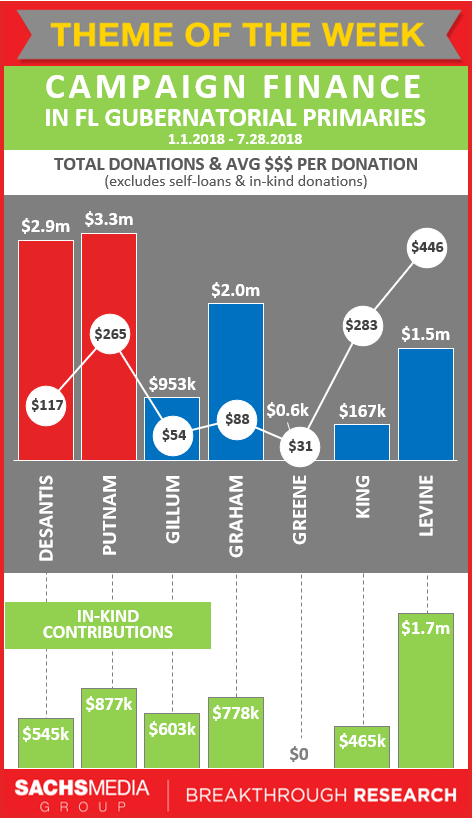
Research infographic depicting total donations and average amount per donation for the Florida gubernatorial primaries. The second bar graph demonstrates the number of in-kind contributions, which is a kind of charitable giving where the goods and services themselves are given to the candidate rather than money.
Posted on
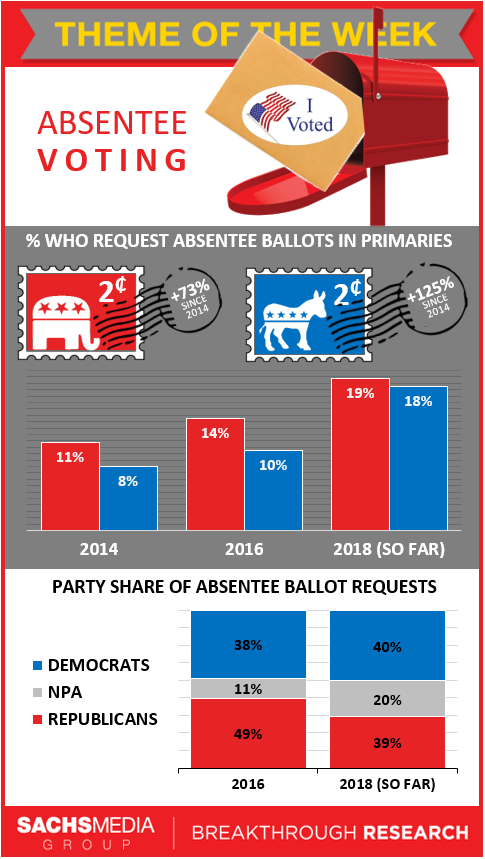
Research infographic describing the percent of requested absentee ballots in the primaries and party share of absentee ballot requests categorized by political party.
Posted on
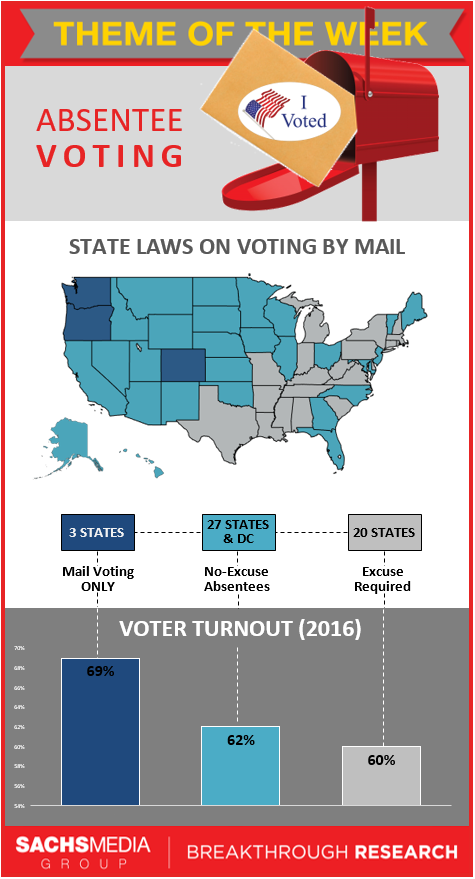
Research infographic describing the state laws on voting by mail throughout the United States.
Posted on
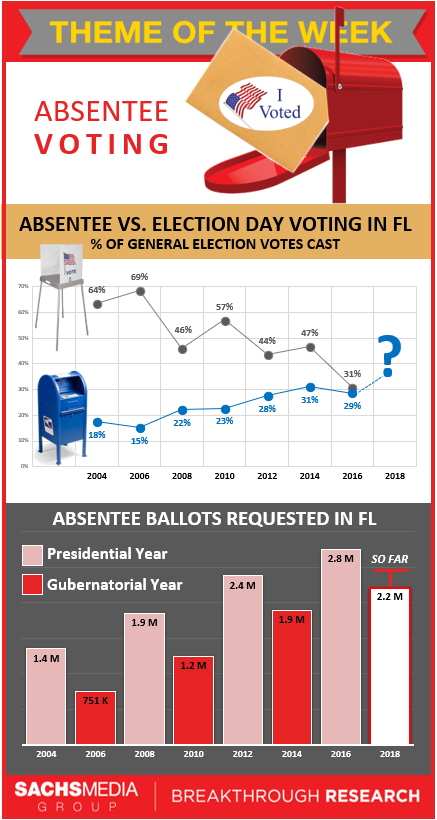
Research infographic depicting the percent of general election votes cast in Florida on election day and through absentee ballots from 2004 to 2016.
Posted on
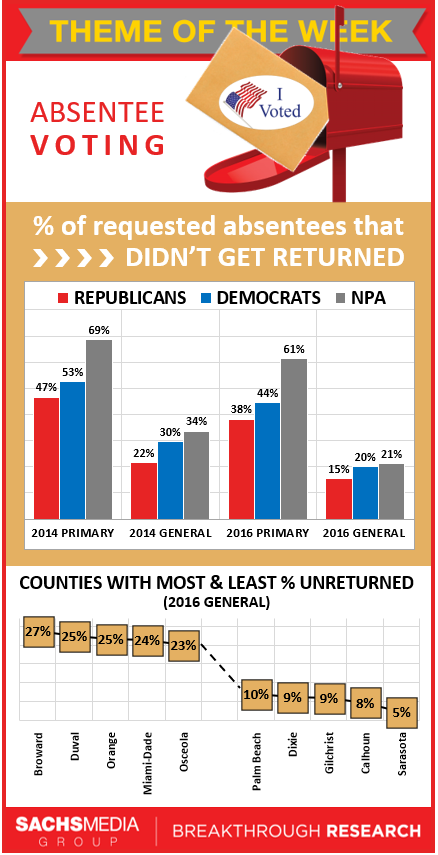
Research infographic describing the percent of requested absentee ballots that didn’t get returned categorized by political party and county in Florida.
Posted on
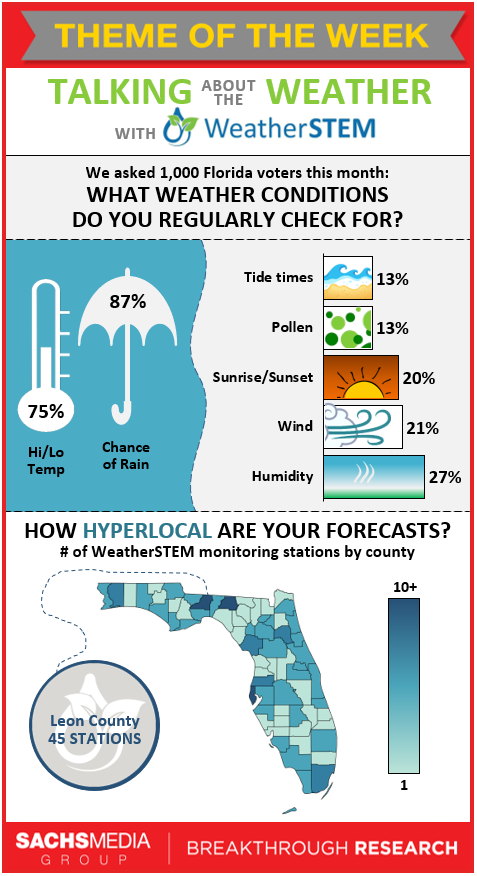
Research infographic describing which weather conditions Floridians regularly check, including temperature, the chance of rain, tide times, pollen, sunrise and sunset, wind and humidity. The lowest diagram depicts the number of WeatherSTEM monitoring stations by county.
Posted on
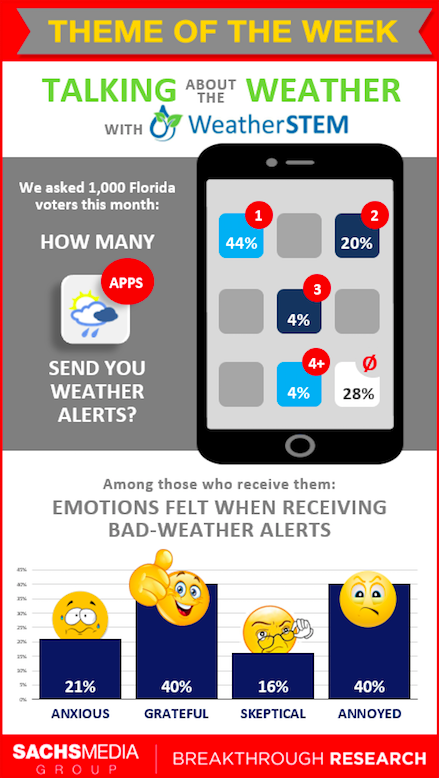
Research infographic describing how many mobile applications send Floridians weather alerts. Most people feel annoyed or grateful when they receive bad-weather alerts.

Copyright © 2021
Terms & Conditions